library(dplyr)
library(RTCGA)
library(ggplot2)
pcaTCGA()
Biplot of RNASeq - Plot of 2 main componens of Principal Components Analysis
## RNASeq expressions
library(RTCGA.rnaseq)
# library(dplyr) if did not load at start
expressionsTCGA(BRCA.rnaseq, OV.rnaseq, HNSC.rnaseq) %>%
   dplyr::rename(cohort = dataset) %>%
   filter(substr(bcr_patient_barcode, 14, 15) == "01") -> BRCA.OV.HNSC.rnaseq.cancer
pcaTCGA(BRCA.OV.HNSC.rnaseq.cancer, "cohort") -> pca_plot
plot(pca_plot)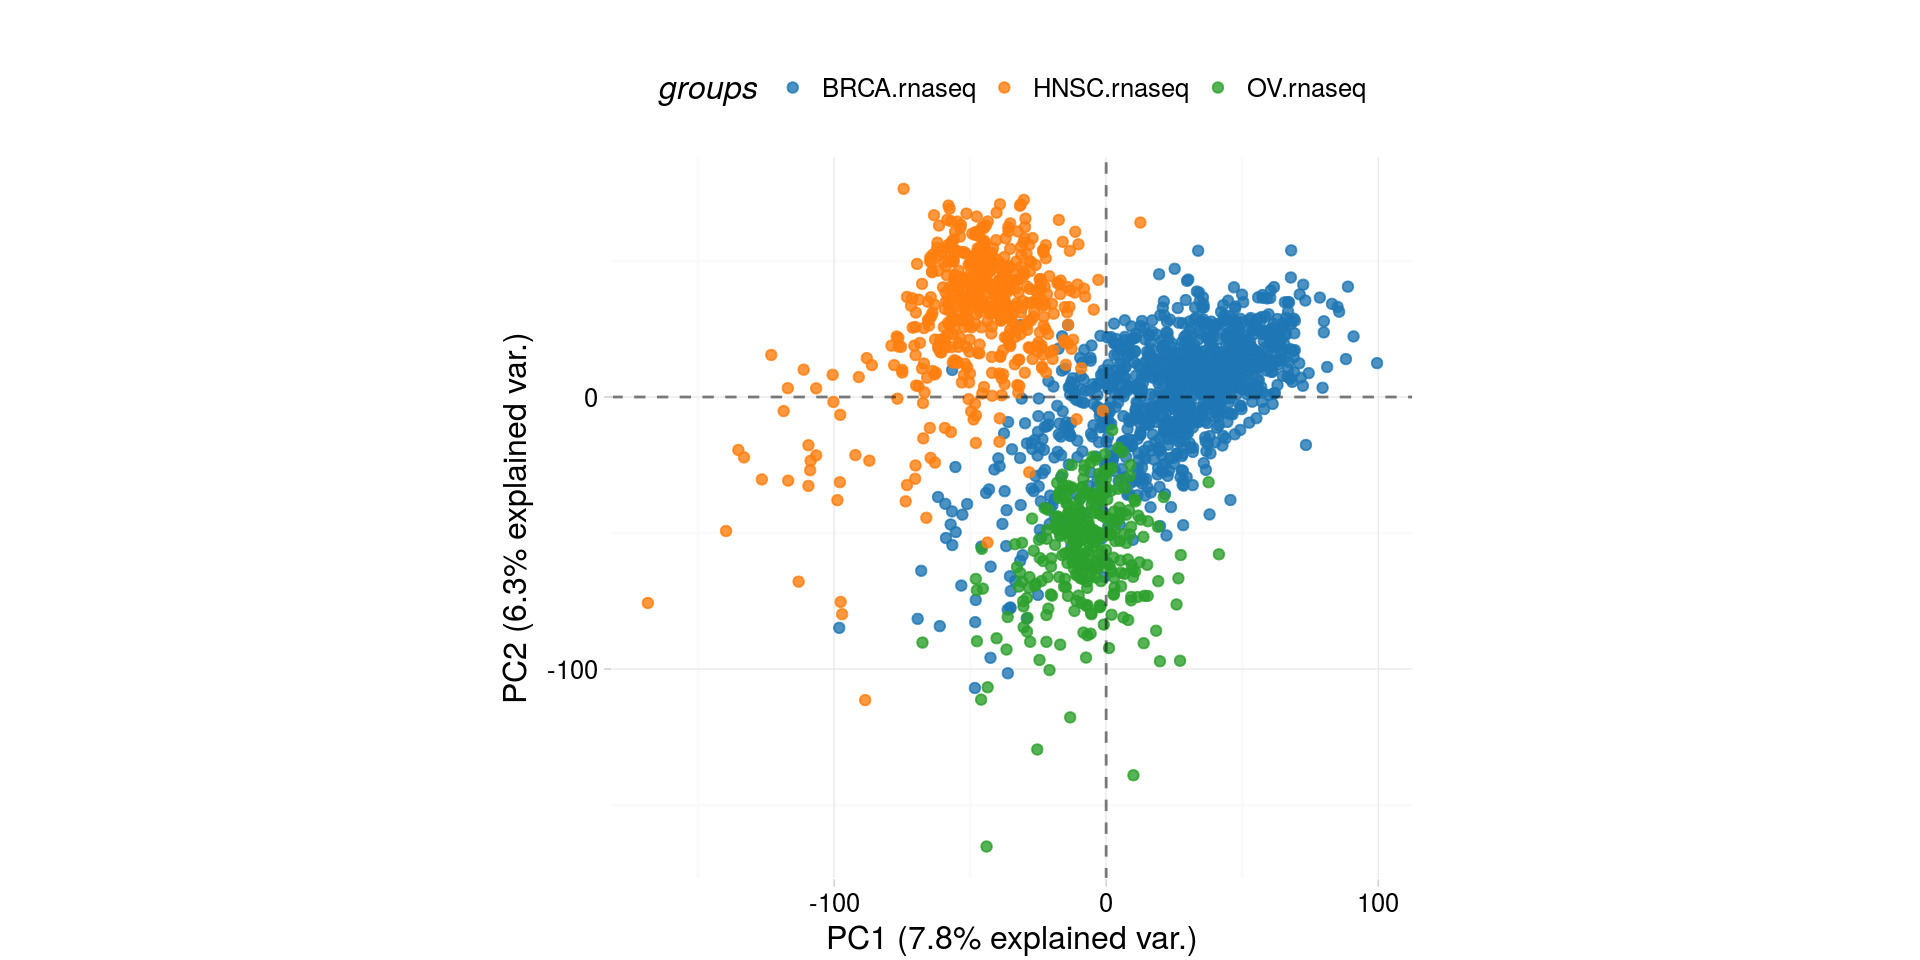
boxplotTCGA()
Boxplots of logarithm of MET gene RNASeq expression
library(RTCGA.rnaseq)
# perfrom plot
# library(dplyr) if did not load at start
expressionsTCGA(
  ACC.rnaseq,
  BLCA.rnaseq,
  BRCA.rnaseq,
  OV.rnaseq,
  extract.cols = "MET|4233"
  ) %>%
   dplyr::rename(
   cohort = dataset,
   MET = `MET|4233`
   ) %>%  #cancer samples
   filter(
   substr(bcr_patient_barcode, 14, 15) == "01"
   ) -> ACC_BLCA_BRCA_OV.rnaseq
boxplotTCGA(
  ACC_BLCA_BRCA_OV.rnaseq,
  "reorder(cohort,log1p(MET), median)",
  "log1p(MET)",
  xlab = "Cohort Type",
  ylab = "Logarithm of MET",
  legend.title = "Cohorts",
  legend = "bottom"
  ) -> boxplot1
plot(boxplot1)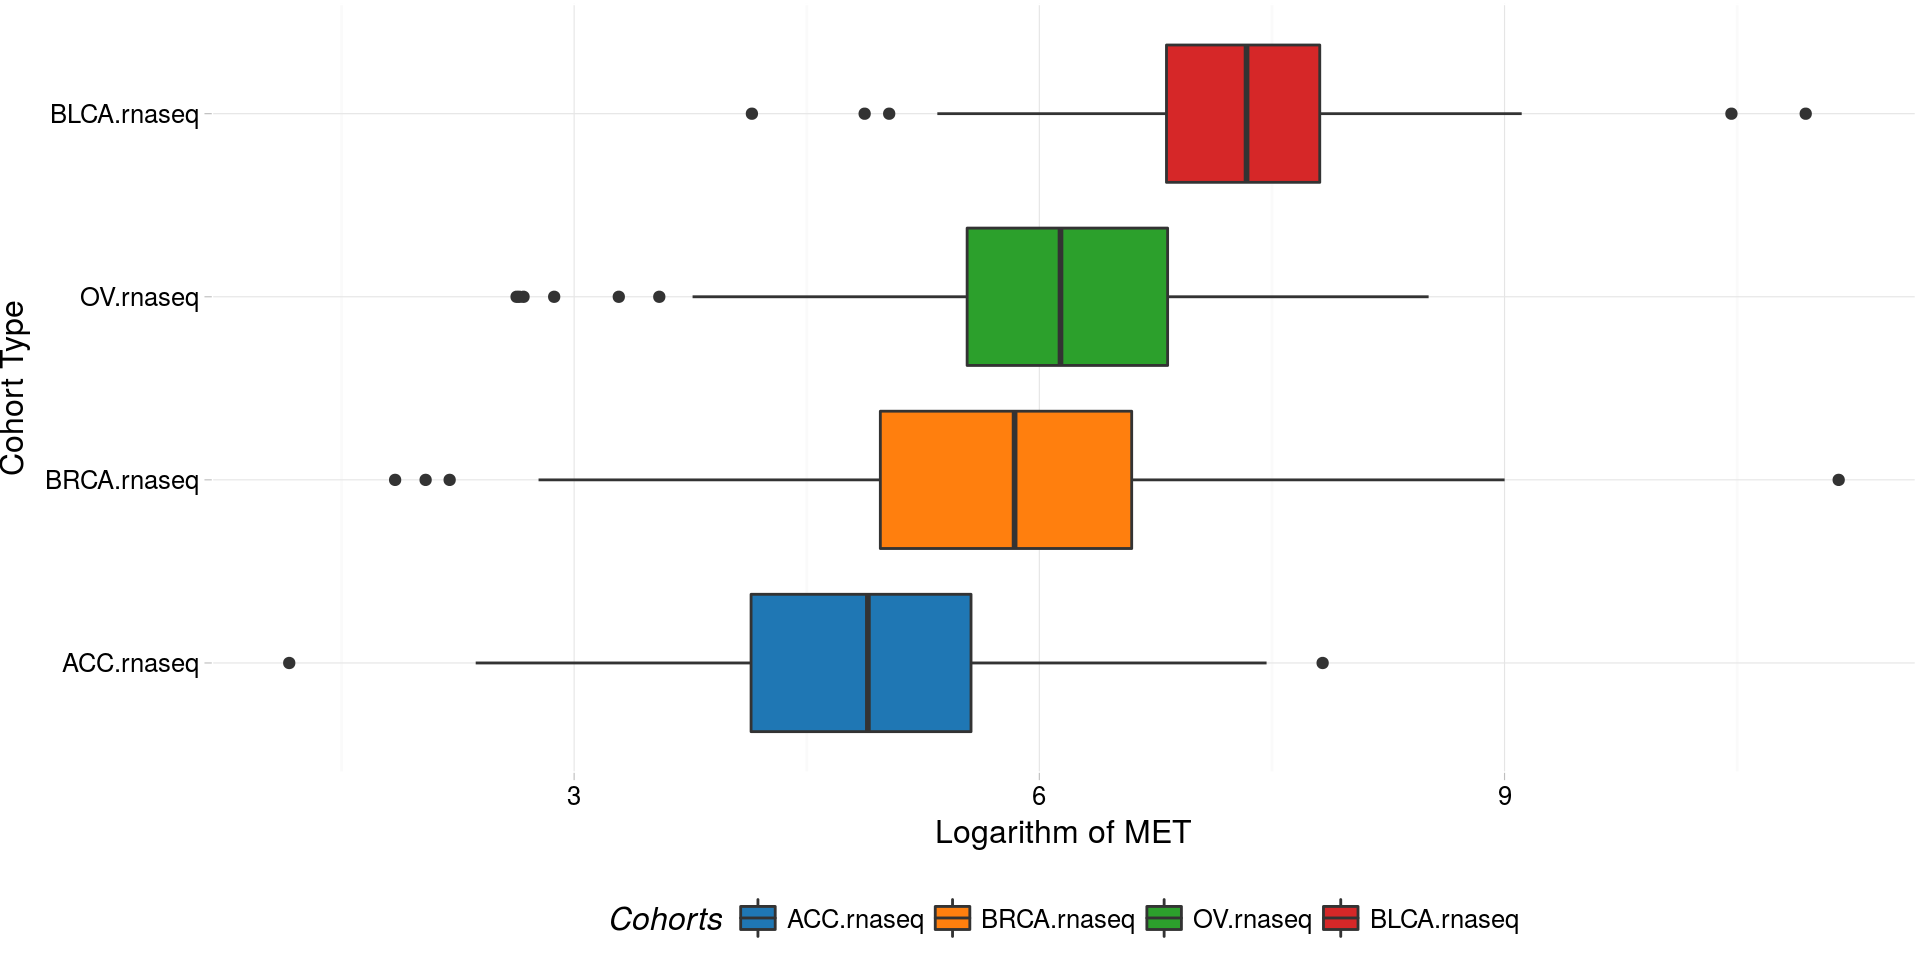
Facet example
library(RTCGA.mutations)
# library(dplyr) if did not load at start
mutationsTCGA(
  BRCA.mutations,
  OV.mutations,
  ACC.mutations,
  BLCA.mutations
  ) %>%
  filter(Hugo_Symbol == 'TP53') %>%
  filter(substr(bcr_patient_barcode, 14, 15) ==
  "01") %>% # cancer tissue
   mutate(bcr_patient_barcode =
   substr(bcr_patient_barcode, 1, 12)) ->
  ACC_BLCA_BRCA_OV.mutations

mutationsTCGA(
  BRCA.mutations,
  OV.mutations,
  ACC.mutations,
  BLCA.mutations
) -> ACC_BLCA_BRCA_OV.mutations_all

 ACC_BLCA_BRCA_OV.rnaseq %>%
   mutate(bcr_patient_barcode =
   substr(bcr_patient_barcode, 1, 15)) %>%
   filter(
   bcr_patient_barcode %in%
   substr(ACC_BLCA_BRCA_OV.mutations_all$bcr_patient_barcode, 1, 15)
   ) %>%
 # took patients for which we had any mutation information
 # so avoided patients without any information about mutations
   mutate(bcr_patient_barcode =
   substr(bcr_patient_barcode, 1, 12)) %>%
 # strin_length(ACC_BLCA_BRCA_OV.mutations$bcr_patient_barcode) == 12
   left_join(
     ACC_BLCA_BRCA_OV.mutations,
     by = "bcr_patient_barcode"
     ) %>% #joined only with tumor patients
   mutate(TP53 =
   ifelse(!is.na(Variant_Classification), "Mut", "WILD")
   ) %>%
   select(cohort, MET, TP53) ->
   ACC_BLCA_BRCA_OV.rnaseq_TP53mutations

boxplotTCGA(
  ACC_BLCA_BRCA_OV.rnaseq_TP53mutations,
  "reorder(cohort,log1p(MET), median)",
  "log1p(MET)",
  xlab = "Cohort Type",
  ylab = "Logarithm of MET",
  legend.title = "Cohorts",
  legend = "bottom",
  facet.names = c("TP53")
  ) -> boxplo2
plot(boxplo2)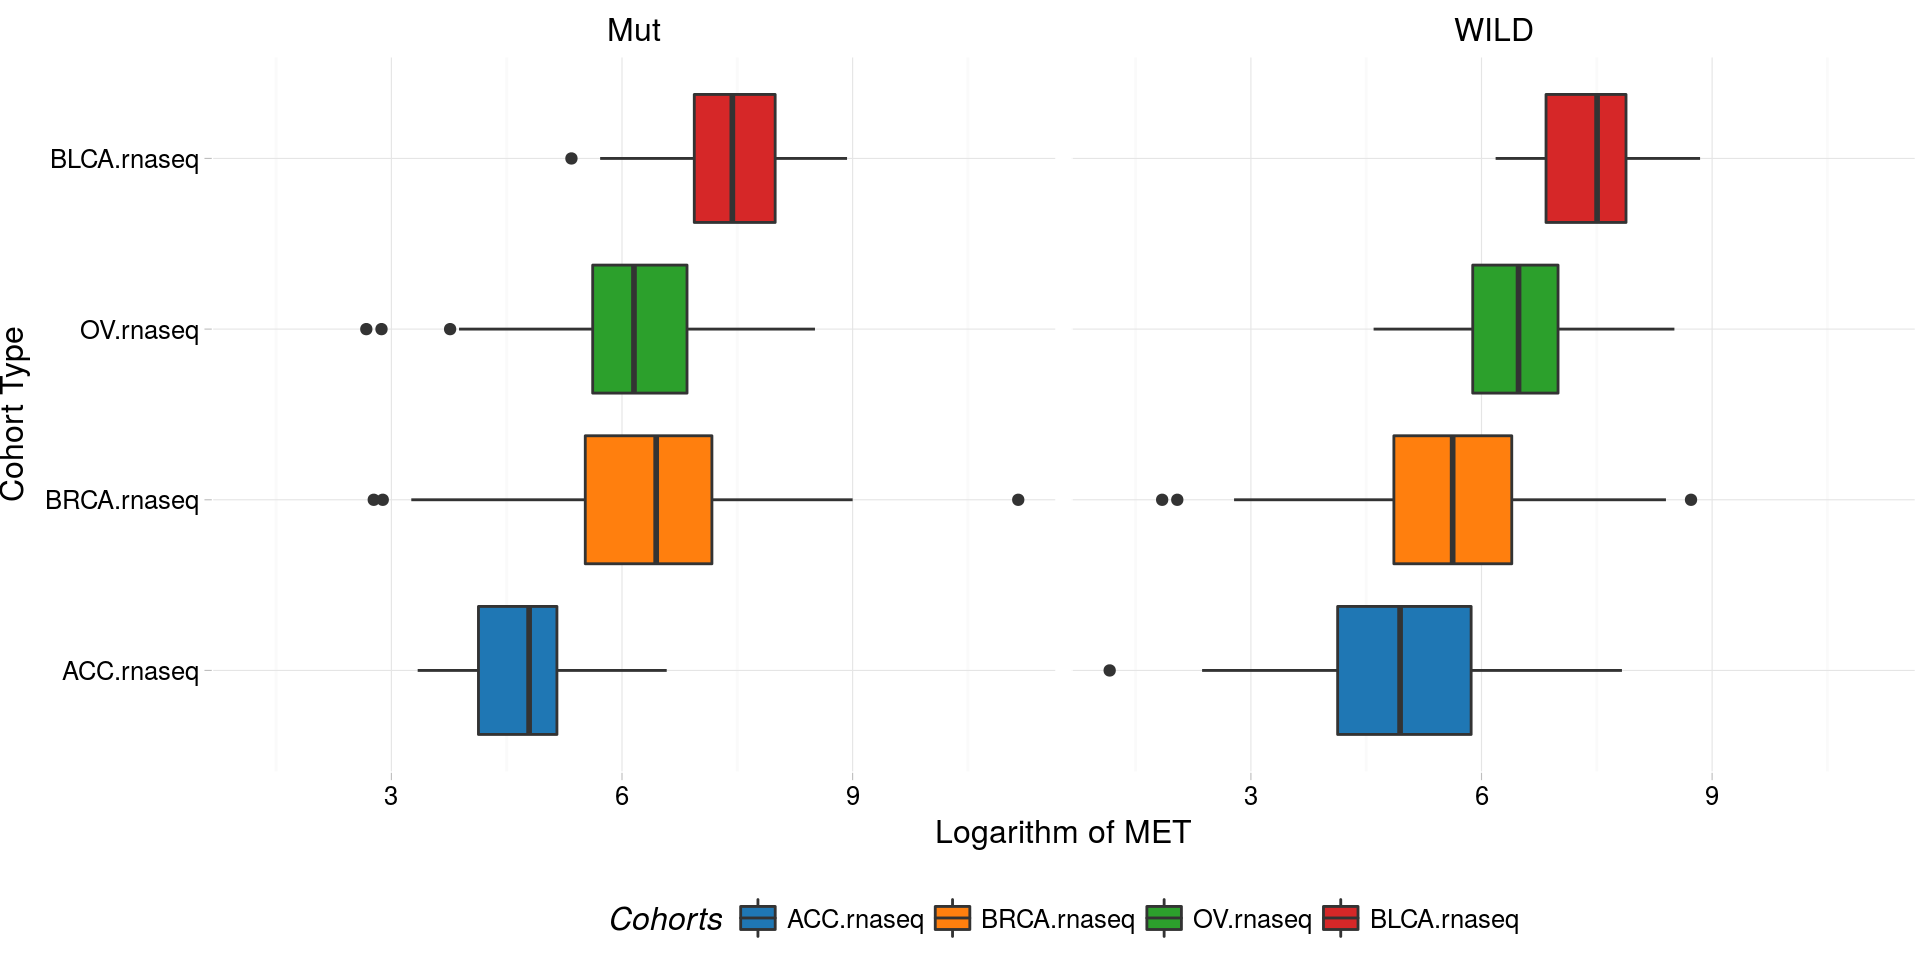
boxplotTCGA(
  ACC_BLCA_BRCA_OV.rnaseq_TP53mutations,
  "reorder(cohort,log1p(MET), median)",
  "log1p(MET)",
  xlab = "Cohort Type",
  ylab = "Logarithm of MET",
  legend.title = "Cohorts",
  legend = "bottom",
  fill = c("TP53")
  ) -> boxplot3
plot(boxplot3)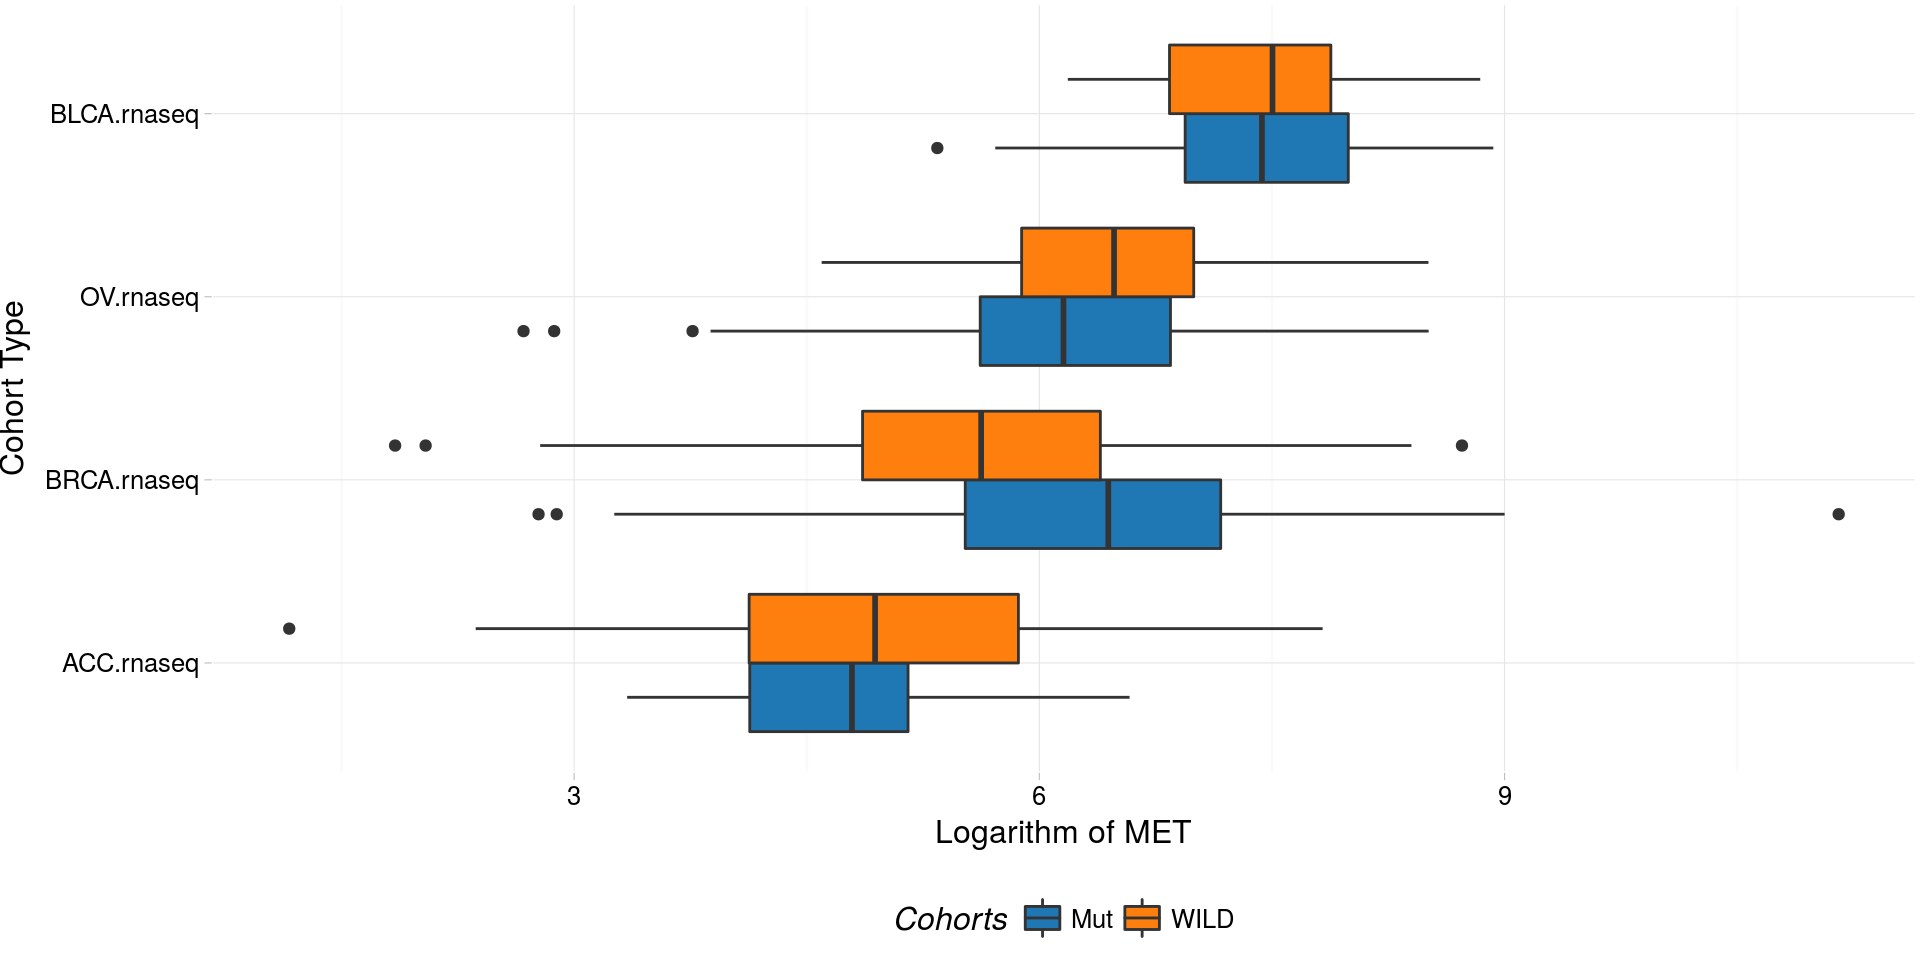
boxplotTCGA(
  ACC_BLCA_BRCA_OV.rnaseq_TP53mutations,
  "reorder(TP53,log1p(MET), median)",
  "log1p(MET)",
  xlab = "Cohort Type",
  ylab = "Logarithm of MET",
  legend.title = "Cohorts",
  legend = "bottom",
  fill = c("cohort")
  ) -> boxplot4
plot(boxplot4)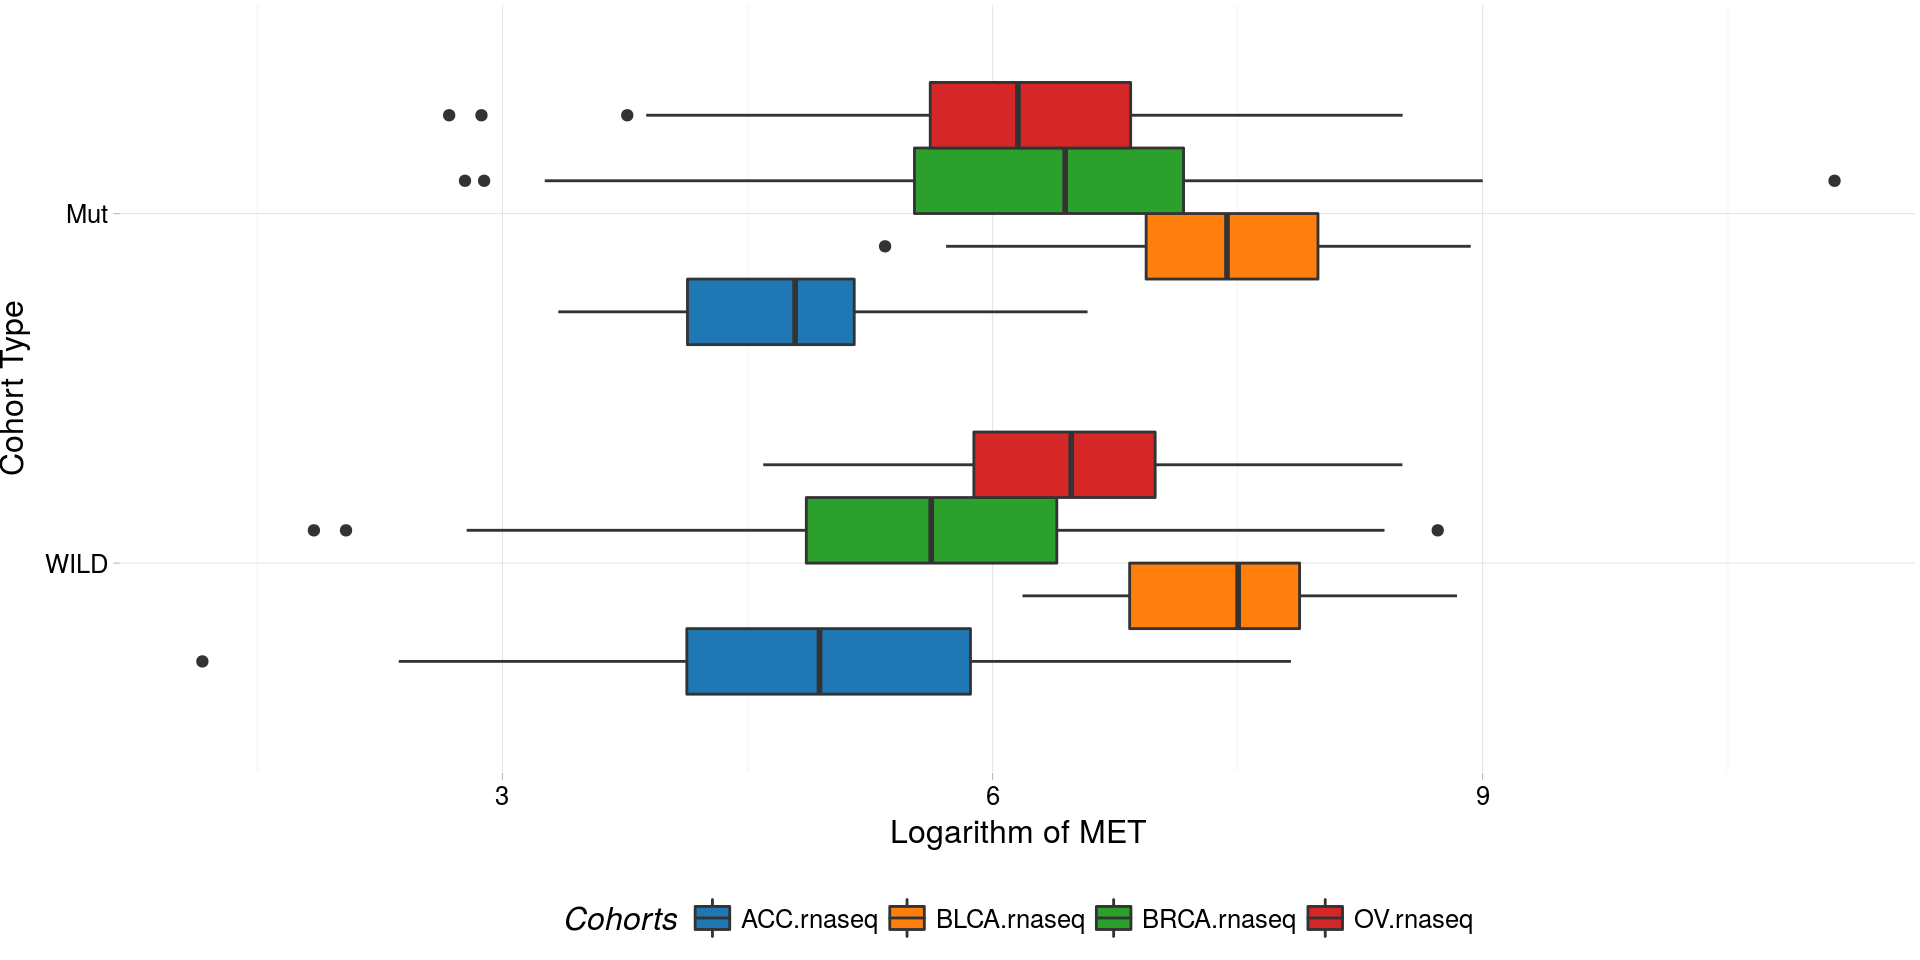
kmTCGA()
Kaplan-Meier estimates of survival curves for BRCA and OV cancer types and mutations in gene TP53
library(RTCGA.mutations)
# library(dplyr) if did not load at start
library(survminer)
mutationsTCGA(BRCA.mutations, OV.mutations) %>%
   filter(Hugo_Symbol == 'TP53') %>%
   filter(substr(bcr_patient_barcode, 14, 15) ==
   "01") %>% # cancer tissue
   mutate(bcr_patient_barcode =
   substr(bcr_patient_barcode, 1, 12)) ->
  BRCA_OV.mutations

library(RTCGA.clinical)
survivalTCGA(
  BRCA.clinical,
  OV.clinical,
  extract.cols = "admin.disease_code"
  ) %>%
   dplyr::rename(disease = admin.disease_code) ->
  BRCA_OV.clinical

BRCA_OV.clinical %>%
   left_join(
     BRCA_OV.mutations,
     by = "bcr_patient_barcode"
     ) %>%
   mutate(TP53 =
   ifelse(!is.na(Variant_Classification), "Mut","WILDorNOINFO")) ->
  BRCA_OV.clinical_mutations

BRCA_OV.clinical_mutations %>%
select(times, patient.vital_status, disease, TP53) -> BRCA_OV.2plot

kmTCGA(
  BRCA_OV.2plot,
  explanatory.names = c("TP53", "disease"),
  break.time.by = 400,
  xlim = c(0,2000),
  pval = TRUE) -> km_plot
print(km_plot)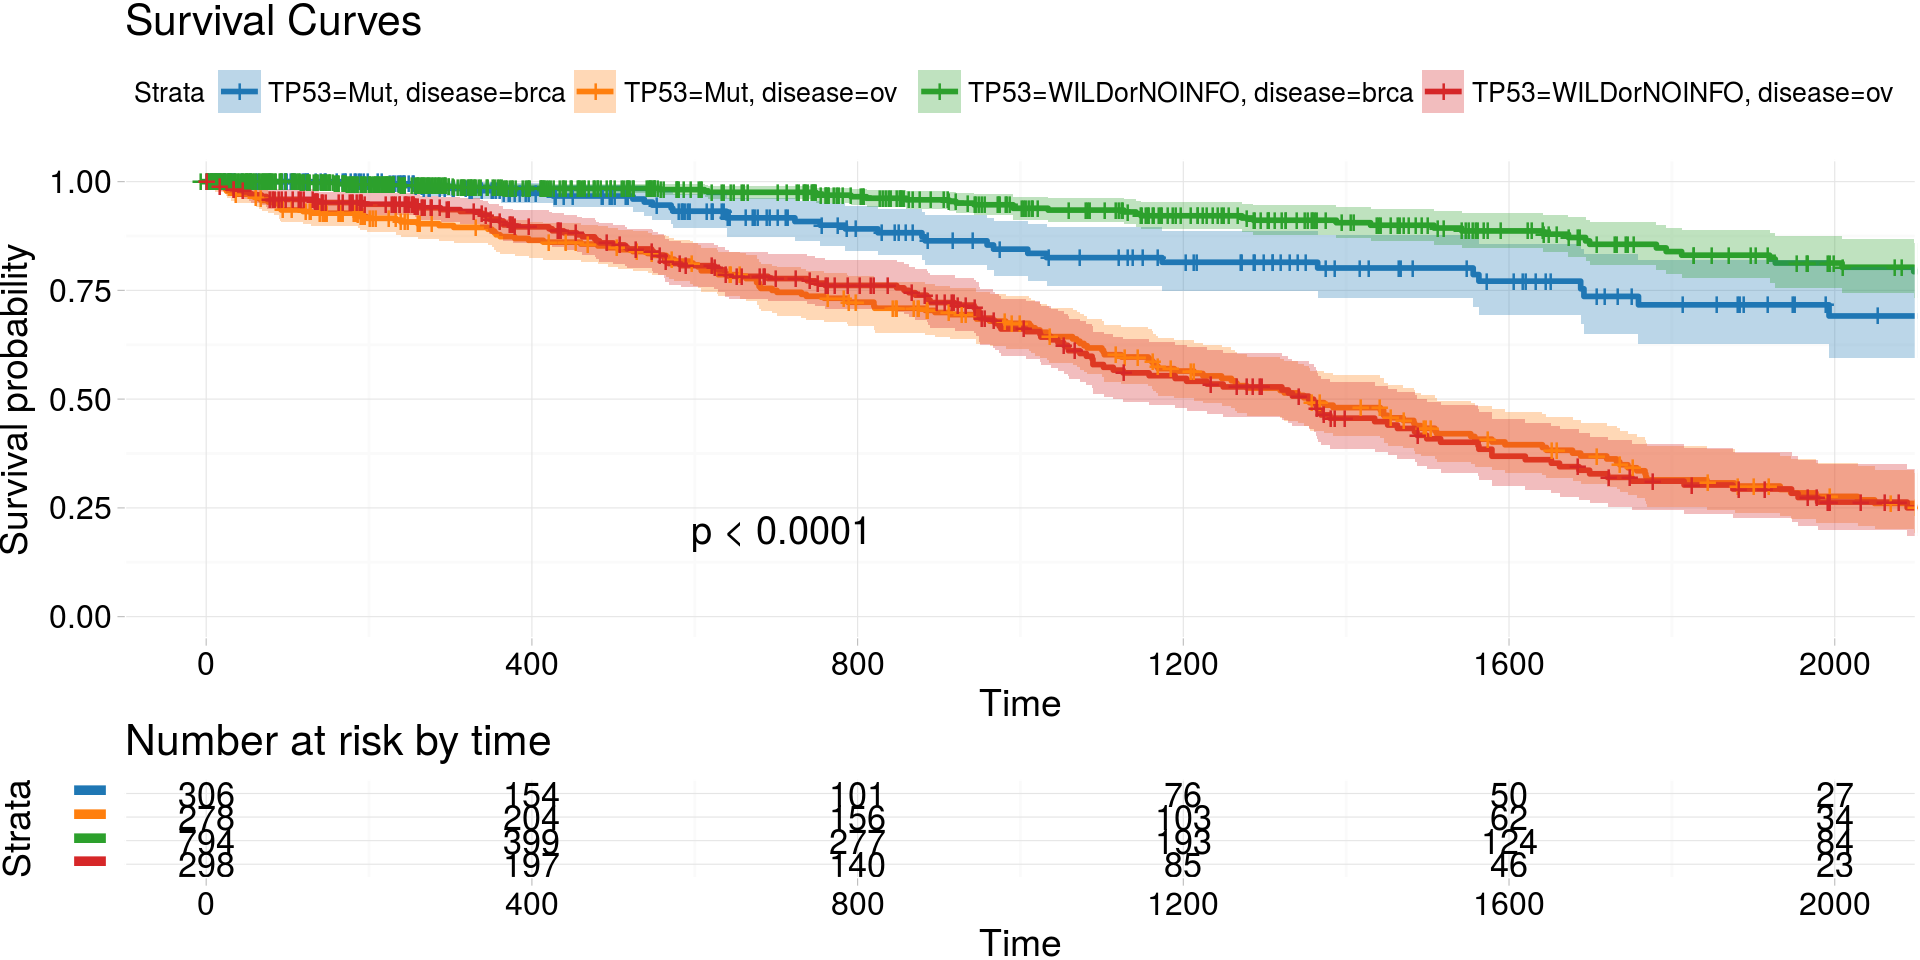
Kaplan-Meier estimates of survival curves for BRAF gene
archivist::aread('MarcinKosinski/coxphSGD/1a06') %>%
  do.call(rbind, . ) %>%
  kmTCGA(
    explanatory.names = "BRAF",
    break.time.by = 1000,
    xlim = c(0, 5000),
    pval = TRUE) -> km_plot2
print(km_plot2)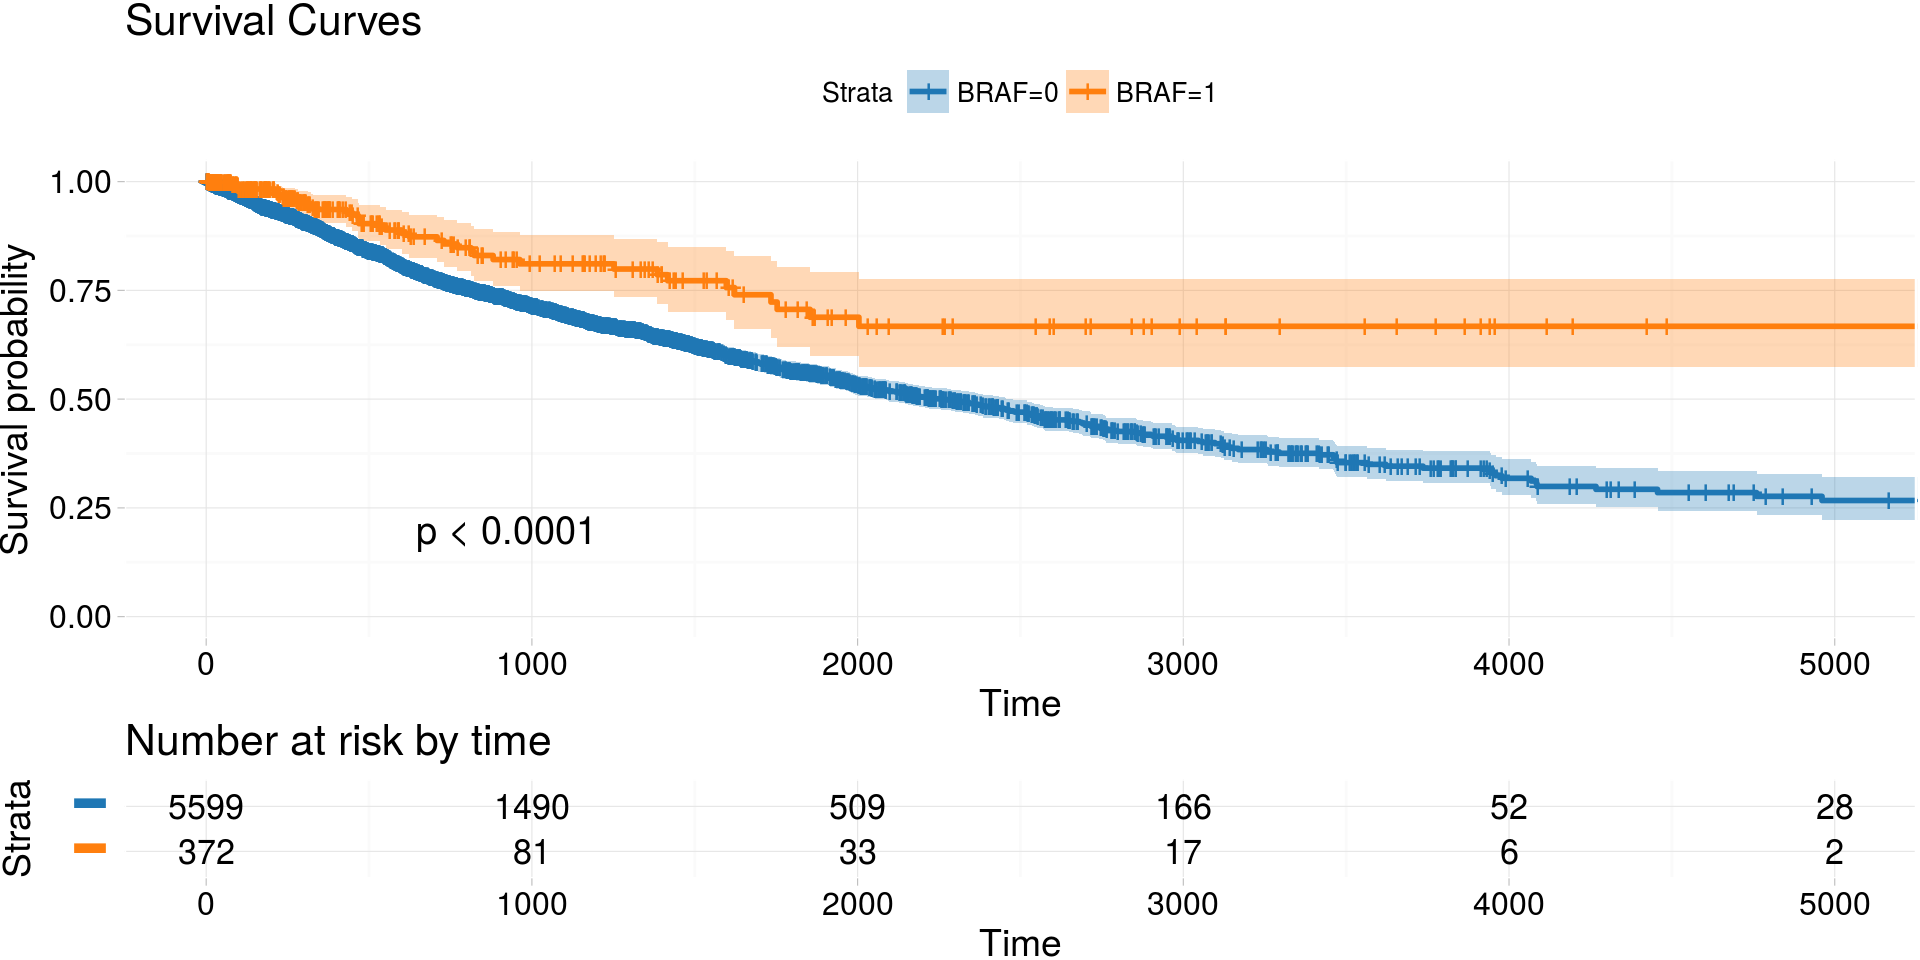
heatmapTCGA()
Heatmap of medians of ZNF500 gene divided on cohort type and MET gene quantiles
library(RTCGA.rnaseq)
# perfrom plot
# library(dplyr) if did not load at start
expressionsTCGA(
  ACC.rnaseq,
  BLCA.rnaseq,
  BRCA.rnaseq,
  OV.rnaseq,
  extract.cols =
    c("MET|4233",
    "ZNF500|26048",
    "ZNF501|115560")
  ) %>%
  dplyr::rename(cohort = dataset,
  MET = `MET|4233`) %>%
  #cancer samples
  filter(substr(bcr_patient_barcode, 14, 15) ==
  "01") %>%
  mutate(MET = cut(MET,
   round(quantile(MET, probs = seq(0,1,0.25)), -2),
   include.lowest = TRUE,
   dig.lab = 5)) -> ACC_BLCA_BRCA_OV.rnaseq

ACC_BLCA_BRCA_OV.rnaseq %>%
  select(-bcr_patient_barcode) %>%
  group_by(cohort, MET) %>%
  summarise_each(funs(median)) %>%
  mutate(ZNF500 = round(`ZNF500|26048`),
  ZNF501 = round(`ZNF501|115560`)) ->
  ACC_BLCA_BRCA_OV.rnaseq.medians
heatmapTCGA(ACC_BLCA_BRCA_OV.rnaseq.medians,
  "cohort", "MET", "ZNF500",
  title = "Heatmap of ZNF500 expression")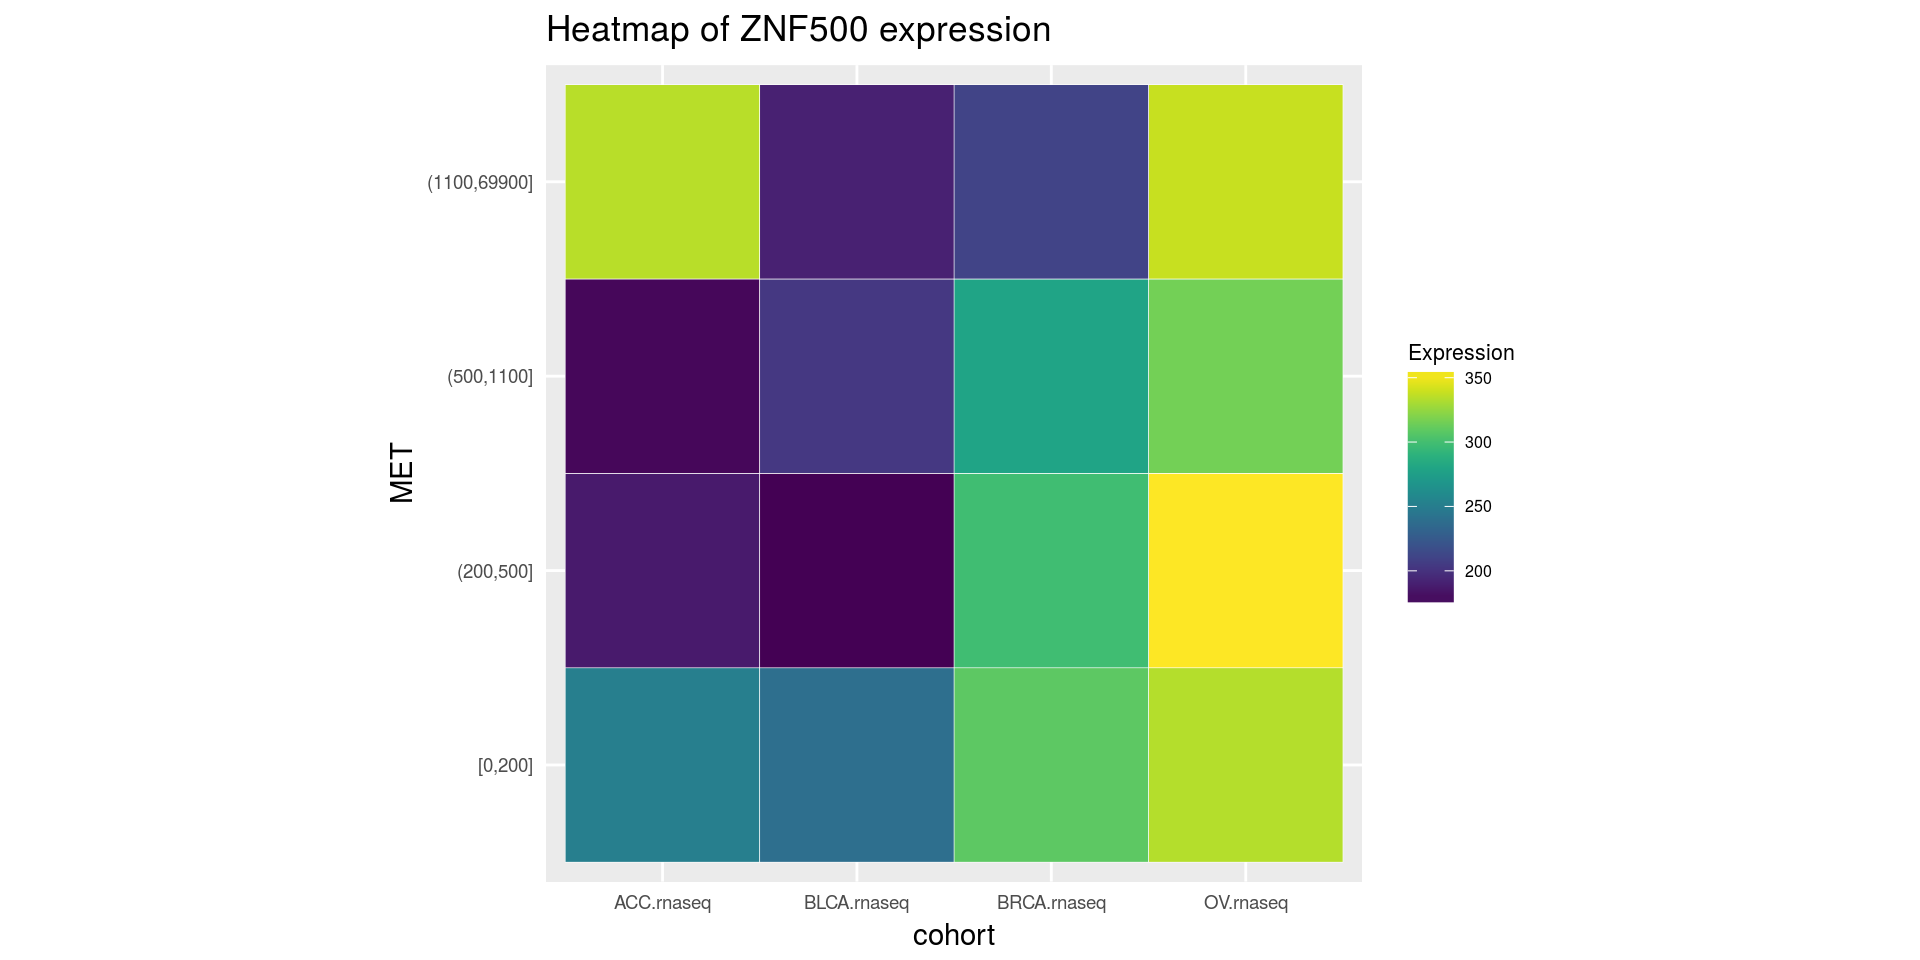
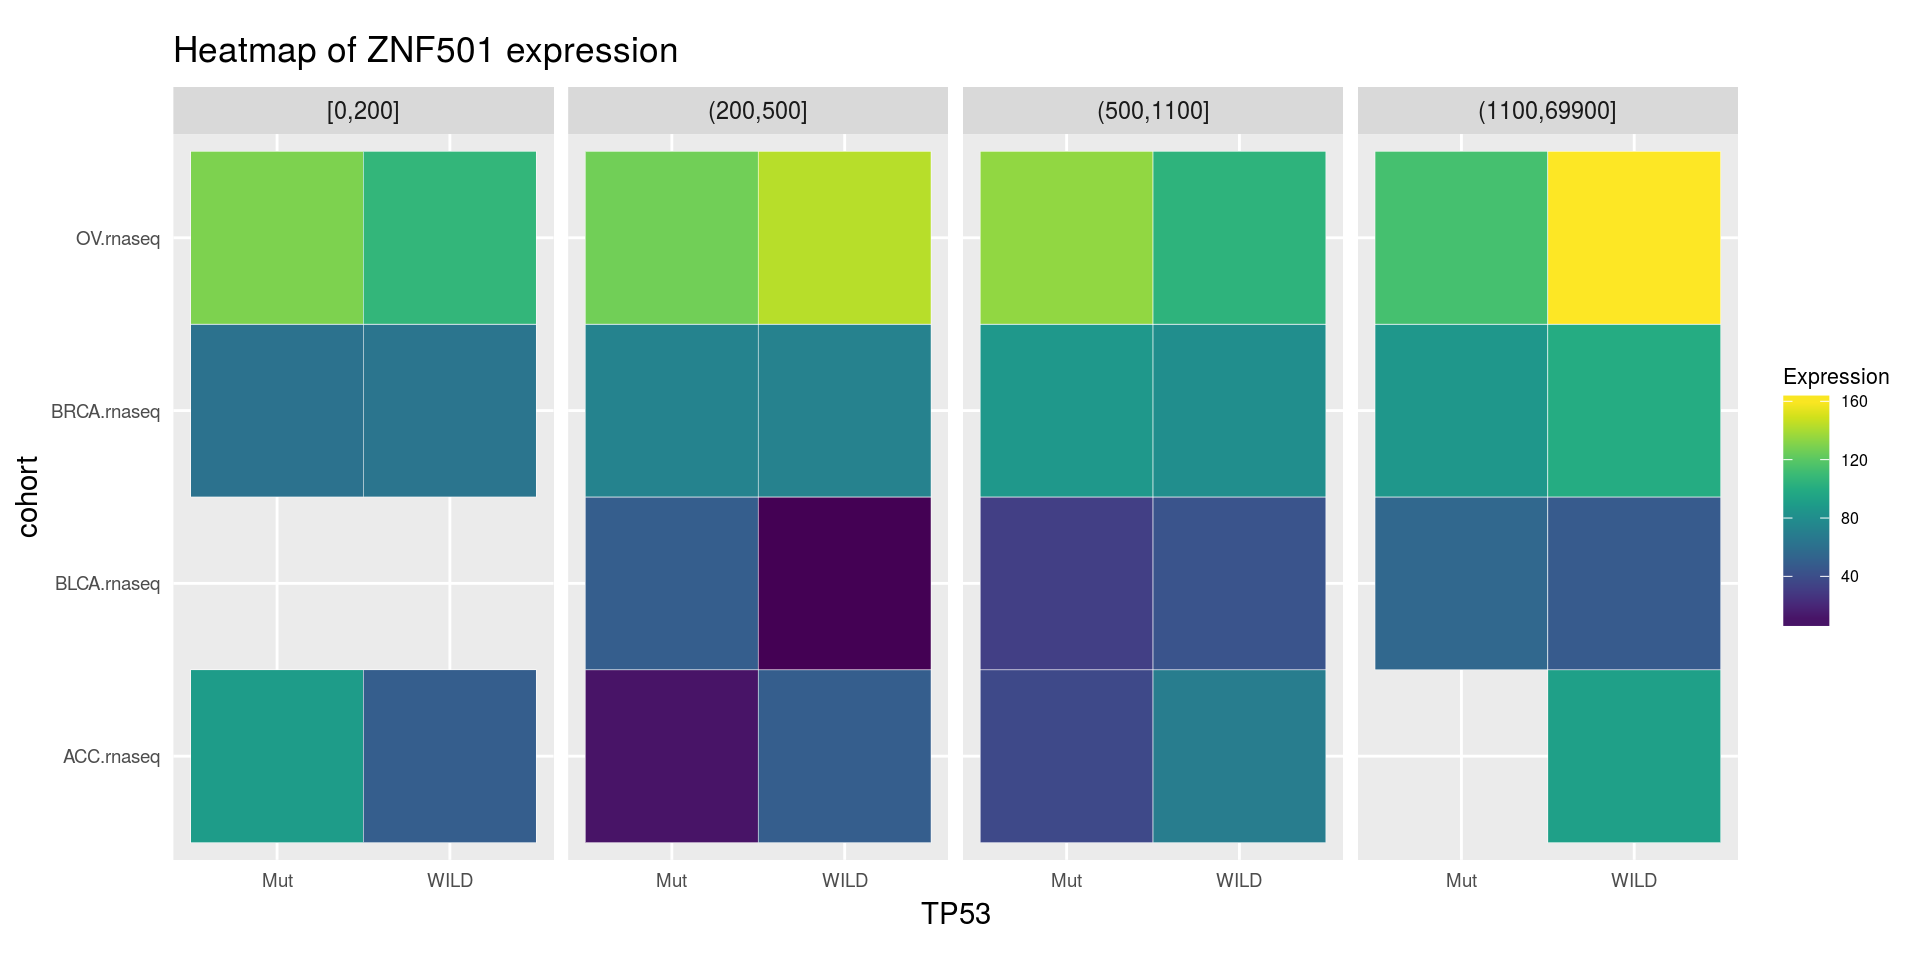
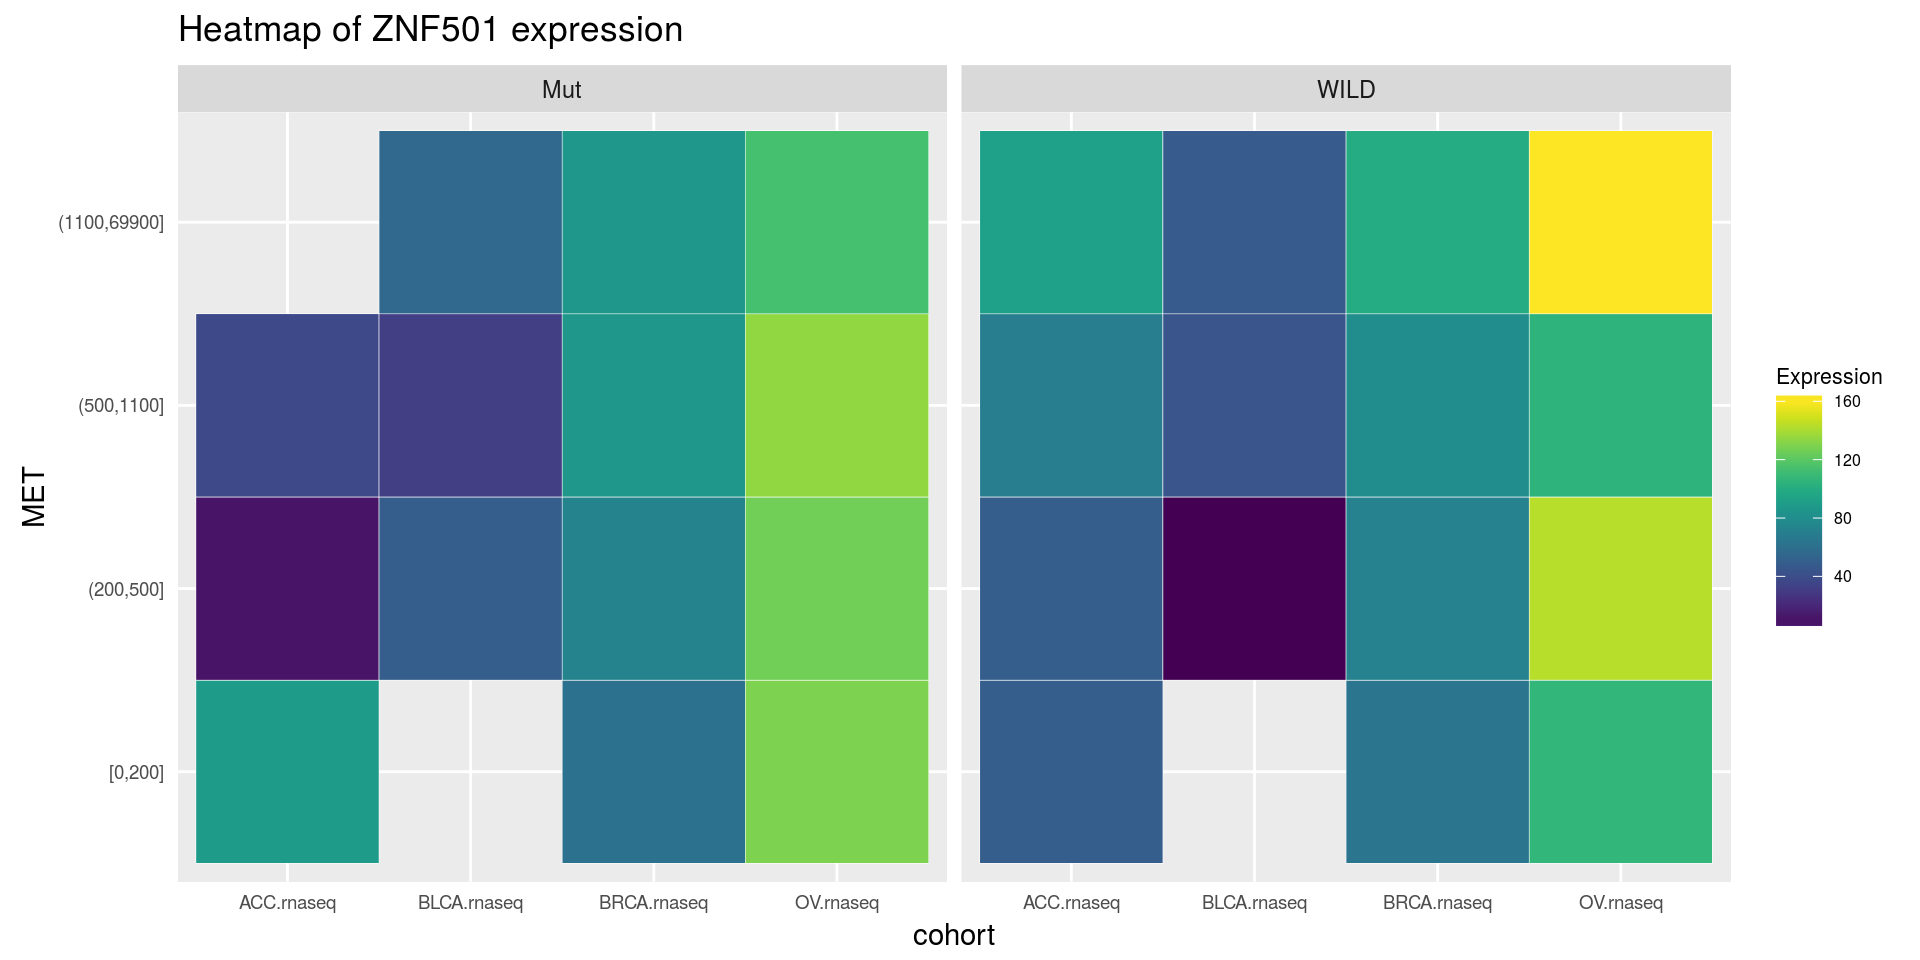
Facet examples with mutations datasets
## facet example
library(RTCGA.mutations)
# library(dplyr) if did not load at start
mutationsTCGA(
  BRCA.mutations,
  OV.mutations,
  ACC.mutations,
  BLCA.mutations
  ) %>%
  filter(Hugo_Symbol == 'TP53') %>%
  filter(substr(bcr_patient_barcode, 14, 15) ==
  "01") %>% # cancer tissue
  mutate(bcr_patient_barcode =
  substr(bcr_patient_barcode, 1, 12)) ->
  ACC_BLCA_BRCA_OV.mutations

mutationsTCGA(
  BRCA.mutations,
  OV.mutations,
  ACC.mutations,
  BLCA.mutations
  ) -> ACC_BLCA_BRCA_OV.mutations_all

ACC_BLCA_BRCA_OV.rnaseq %>%
  mutate(bcr_patient_barcode =
  substr(bcr_patient_barcode, 1, 15)) %>%
  filter(bcr_patient_barcode %in%
substr(ACC_BLCA_BRCA_OV.mutations_all$bcr_patient_barcode, 1, 15)) %>%
# took patients for which we had any mutation information
# so avoided patients without any information about mutations
  mutate(bcr_patient_barcode =
  substr(bcr_patient_barcode, 1, 12)) %>%
# strin_length(ACC_BLCA_BRCA_OV.mutations$bcr_patient_barcode) == 12
  left_join(ACC_BLCA_BRCA_OV.mutations,
  by = "bcr_patient_barcode") %>% #joined only with tumor patients
  mutate(TP53 =
  ifelse(!is.na(Variant_Classification), "Mut", "WILD")
  ) %>%
  select(-bcr_patient_barcode, -Variant_Classification,
  -dataset, -Hugo_Symbol) %>%
  group_by(cohort, MET, TP53) %>%
  summarise_each(funs(median)) %>%
  mutate(ZNF501 = round(`ZNF501|115560`)) ->
  ACC_BLCA_BRCA_OV.rnaseq_TP53mutations_ZNF501medians

heatmapTCGA(
  ACC_BLCA_BRCA_OV.rnaseq_TP53mutations_ZNF501medians,
  "cohort",
  "MET",
  fill = "ZNF501",
  facet.names = "TP53",
  title = "Heatmap of ZNF501 expression"
)
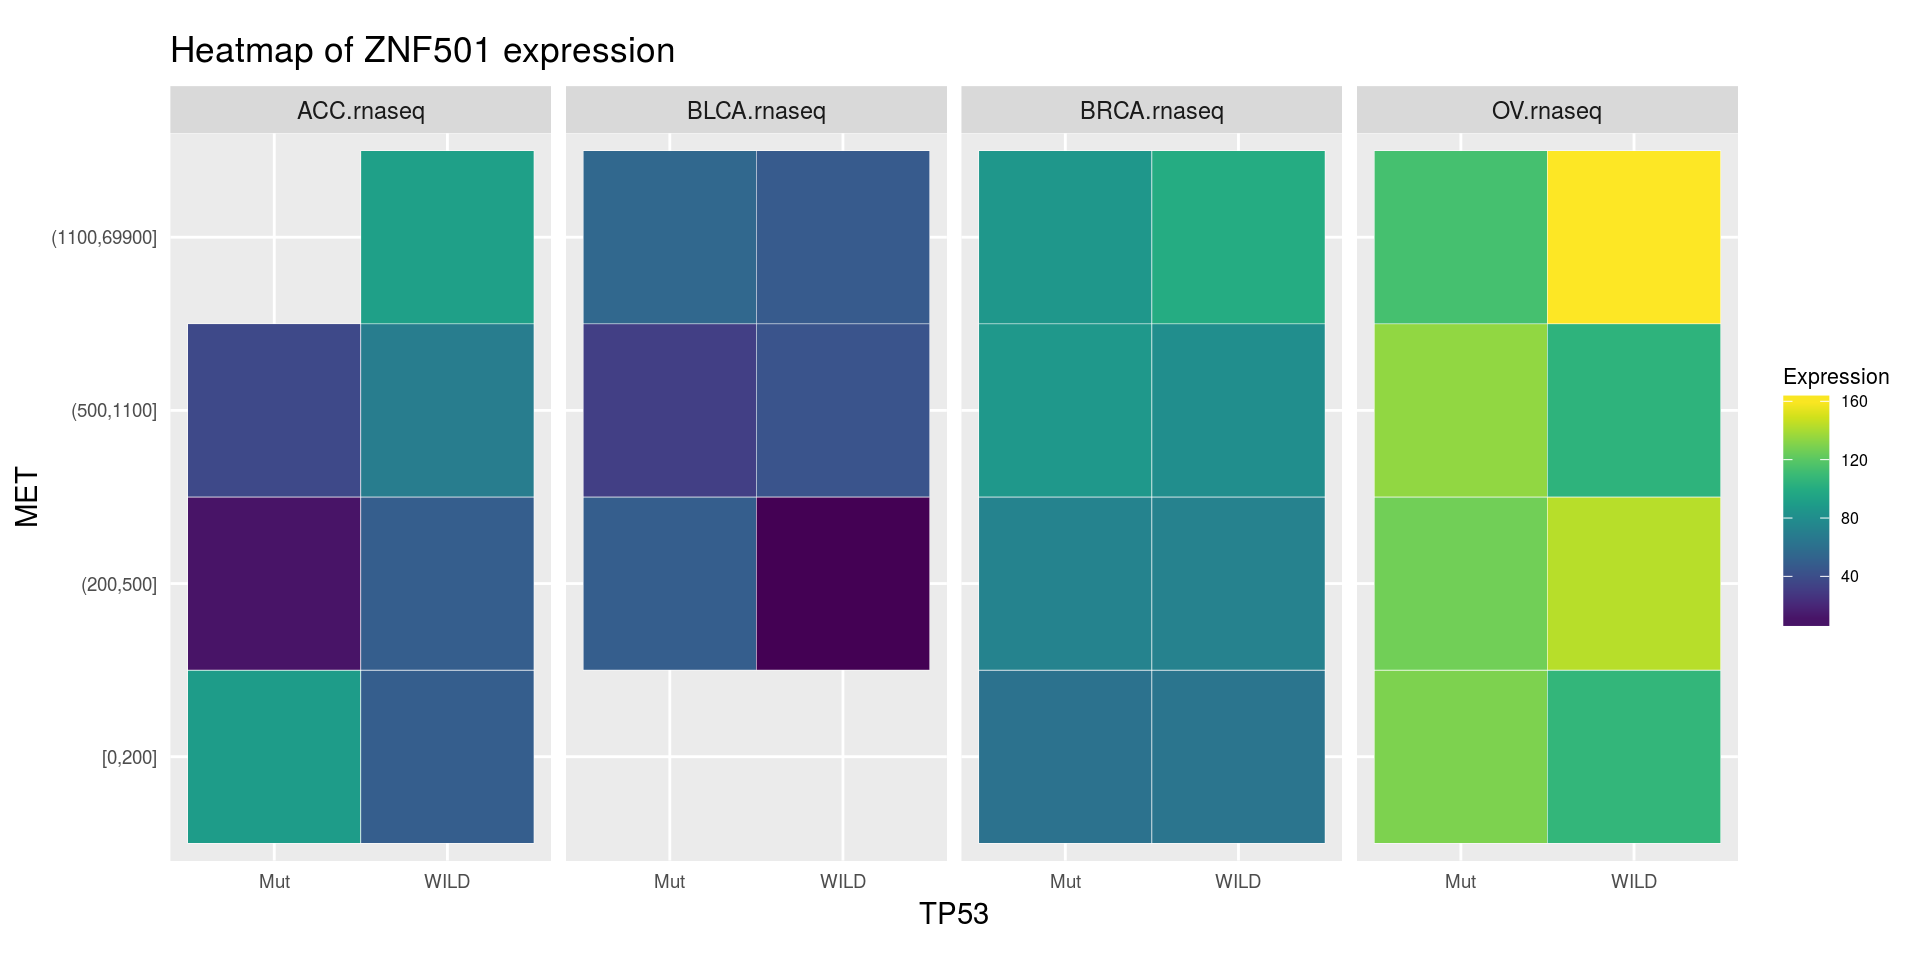
heatmapTCGA(
  ACC_BLCA_BRCA_OV.rnaseq_TP53mutations_ZNF501medians,
  "TP53",
  "MET",
  fill = "ZNF501",
  facet.names = "cohort",
  title = "Heatmap of ZNF501 expression"
)
heatmapTCGA(
  ACC_BLCA_BRCA_OV.rnaseq_TP53mutations_ZNF501medians,
  "TP53",
  "cohort",
  fill = "ZNF501",
  facet.names = "MET",
  title = "Heatmap of ZNF501 expression"
)